
Five Years of Rising Prices: What the Inflation Charts Show
A Five-Year Run of Rising Prices
Inflation has now been part of American economic life for more than five years, according to a MarketWatch report published on September 26, 2026. The report uses a series of charts to show how prices have climbed across everyday categories, from a half-dozen eggs to a new car, and argues that the cumulative effect has been to crush consumer confidence and bite into household budgets.
The framing matters. A single month of price data is a snapshot. Five years of it is a change in the baseline against which Americans judge every purchase, every paycheck and every monthly budget. The MarketWatch report does not present inflation as a one-off shock that has passed, but as a condition that has settled into the way households plan.
The report's title points to two very different price tags: a carton of eggs and a $50,000 car. Those two items sit at opposite ends of the household spending spectrum, and that is the point. Inflation is not confined to big-ticket purchases that families can postpone, nor to small ones they can absorb. It shows up in both, and it shows up repeatedly.
What the Charts Are Measuring
When news organizations publish inflation charts, they are usually drawing on the same underlying machinery: price indexes that track a fixed basket of goods and services over time. The best known of these is the Consumer Price Index, produced by the Bureau of Labor Statistics, which measures the average change over time in the prices paid by urban consumers for a market basket of consumer goods and services.
The index is not a single number so much as a weighted average. Housing, food, energy, medical care, transportation and other categories each carry a weight reflecting how much of a typical household budget they consume. That weighting is why two people can experience the same official inflation rate very differently. A renter in a hot housing market and a homeowner with a fixed mortgage are not exposed to the same price changes. A household that drives long distances feels gasoline and insurance costs more acutely than one that does not.
The MarketWatch report's use of eggs and cars illustrates this. Eggs are a frequent, small purchase that shoppers notice. Cars are an infrequent, large one that requires financing. Both have moved, according to the report, and both feed into how people feel about the cost of living.
Why Confidence Has Not Recovered
Consumer confidence is a survey-based measure of how households feel about their finances and the economy. It matters because spending is the largest component of United States economic output, and households that feel squeezed tend to spend differently. They trade down, delay purchases, draw on savings or take on debt.
The MarketWatch report links five years of rising prices directly to that sour mood. The mechanism is straightforward. Wages may rise over time, but they do not rise in lockstep with prices for every worker. When prices climb faster than pay for a sustained period, the gap shows up as a lower standard of living, even if the official unemployment rate looks healthy.
There is also a psychological component that economists have studied for decades. People react more strongly to price increases than to equivalent price decreases. A price that rises and then falls back to where it started can still leave shoppers feeling worse off, because the increase is what they remember. After five years of increases, that effect compounds.
What This Means for Household Budgets
For American readers, the practical consequence of a five-year inflation run is that budgeting assumptions made in earlier years may no longer hold. A grocery list, a car payment, an insurance premium or a utility bill that was planned around older prices can quietly become a strain.
- Food at home: frequent purchases where shoppers see price changes week to week.
- Vehicles: large, often financed purchases where the monthly payment is shaped by both price and interest rates.
- Housing: typically the largest single line in a household budget, whether rented or owned.
- Energy and transportation: volatile categories that can swing sharply and feed into the cost of almost everything else.
The report does not offer a forecast, and neither does this article. What it documents is a period, not a prediction. Whether the next five years look like the last five is an open question that depends on monetary policy, supply conditions, wage growth and a long list of other forces.
The Policy Context
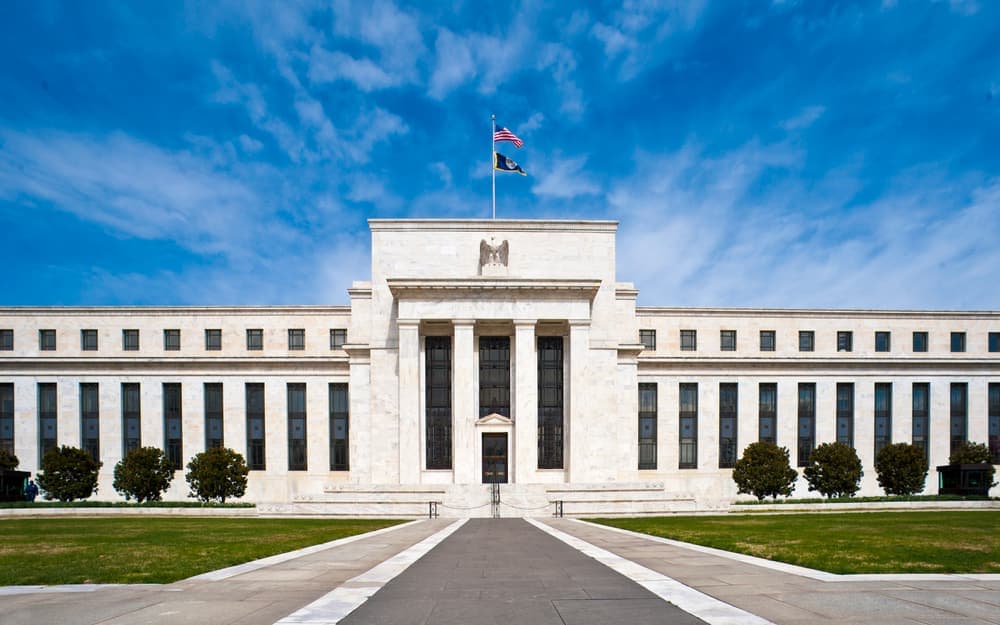
The Federal Reserve's mandate includes promoting maximum employment and stable prices. When inflation runs above the central bank's longer-run goal, the Fed's usual tool is raising interest rates to cool demand. That tool works with a lag, and it works unevenly. Higher rates raise the cost of mortgages, car loans, credit card balances and business borrowing.
That creates a difficult trade-off that has defined much of this period. The same rate increases intended to bring prices down also raise costs for households already stretched by higher prices. The MarketWatch report's emphasis on consumer confidence reflects that tension: even when the inflation rate moderates, the level of prices remains elevated, and households experience the level, not the rate of change.
This distinction between the rate of inflation and the price level is one of the most commonly misunderstood points in economic coverage. If inflation falls from a high rate to a lower one, prices are still rising, just more slowly. They do not return to their earlier level unless there is outright deflation, which is rare and generally considered harmful because it can encourage households and businesses to delay spending.
What to Watch From Here
The report's value is as a record rather than a forecast. It assembles five years of price changes into a single view, which is difficult to hold in mind when each month's data arrives separately.
For readers, the useful takeaway is structural. Inflation is not only a headline number released on a schedule. It is the sum of thousands of individual prices that households encounter in different proportions depending on where they live, what they earn, what they owe and what they buy. Two families can read the same inflation report and correctly conclude that their own experience was different.
What happens next will depend on data that has not yet been published. The MarketWatch report does not claim to know the answer, and it does not need to. Its contribution is to show, in chart form, how the past five years have reshaped the cost of ordinary American life, and why that reshaping continues to show up in how consumers say they feel.
Source: MarketWatch
This article is for information only and is not investment advice, a recommendation, or an offer to buy or sell any security. Figures are sourced from third-party market data providers and may be delayed. Do your own research before investing.